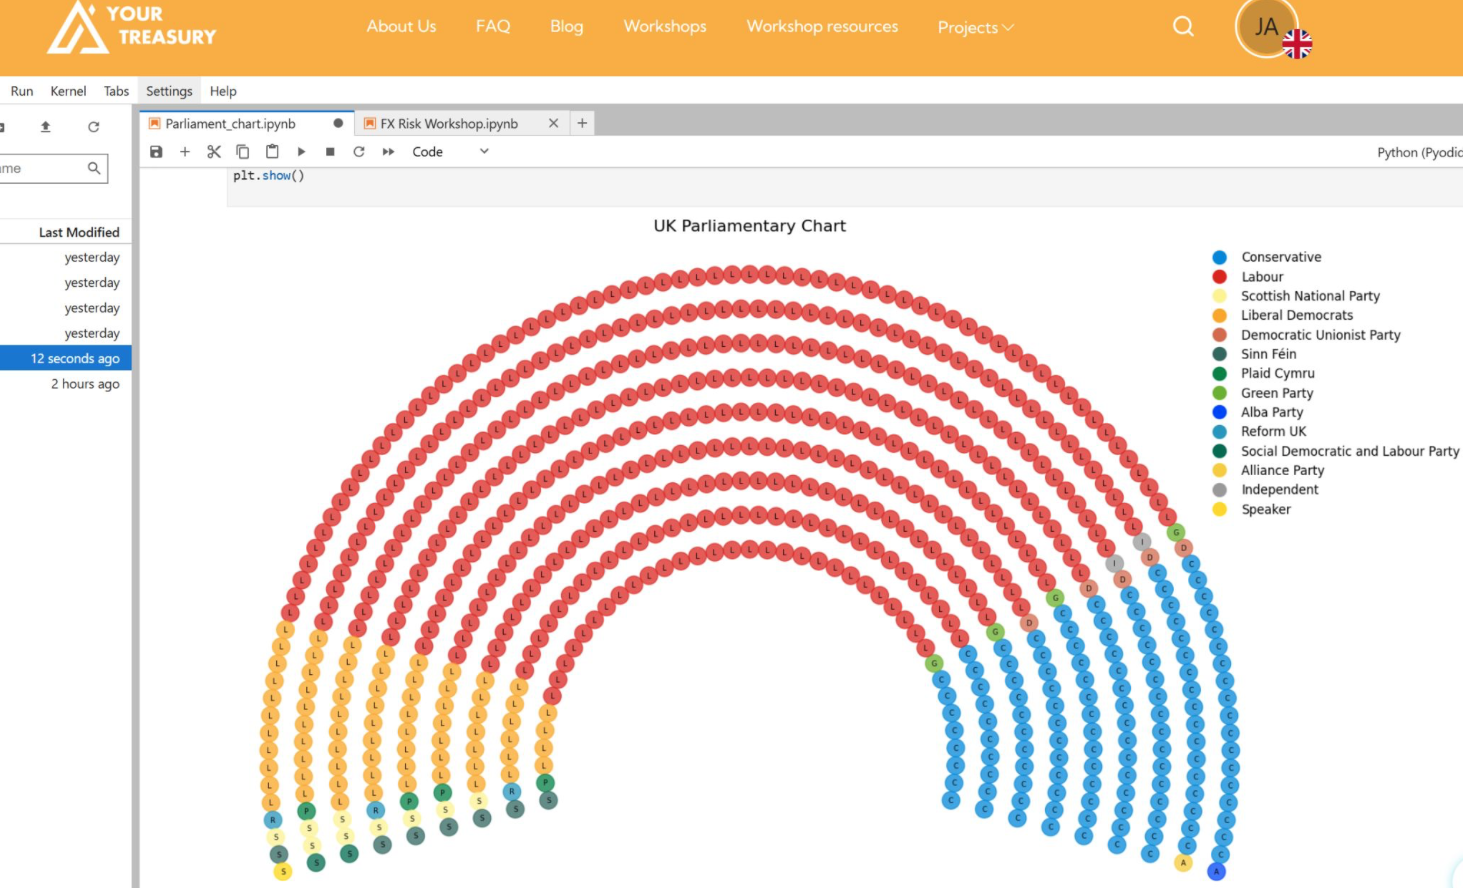
One of the great things about python is being able to create awesome graphics.
U-Danny wrote a really nice article in Medium (link in the comments) to create a parliament chart, which he showed with a sample of 255 data points, so I thought I'd create my own based on the UK parliament with the most recent election results
I changed the setup to use matplotlib to run in the your treasury environment, rather than plotly and then updated the chart to allow more rows, more colours and a few other features. Overall it's a nice useful chart.
So, how can this apply to treasury? Parliament charts are great alternatives to pie charts, especially where you have a long tail of 'other' categories. A great example would be bank accounts - Pearson has roughly 650 bank accounts and while the majority are with 5 or 6 banks, there are a number with regional banks that would get wrapped up in other. By representing the accounts visually this way, you can present each account and make them clickable so that a user could see the balance on that account or further details such as signatories.
Pie charts and summarised data work well for the board but in operations it's helpful to be able to see the detail. Bubble charts are another great option for showing the relative sizes of balances or the relative volume of flows in an intuitive way.
Another finance use case for parliament charts is in visually representing different functions (e.g. a pie chart for the number of people in finance wouldn't include functions like IR and treasury which have relatively few people).
Starting next week, our Your Treasury workshops will provide a solid foundation on how Python can be leveraged to help treasurers create and use charts that can be seamlessly integrated into daily operations for improved efficiency. At Your Treasury, we aim to support professionals in making this transition as the corporate landscape increasingly embraces artificial intelligence and automation.
Ready to kickstart your Python journey in creating charts? Download the PDF below to uncover Your Treasury's insider tips for crafting effective visuals. Consider this a sneak peek into all the valuable insights our workshops have to offer.

# Function to calculate coordinates for parliamentary chart
def parlamentary_Coord(df, angle_total=210, rows=9, ratio=6, initial='NAME'):
    arco_total = 0
    angles = []
    for i in range(rows):
        arco_total += math.pi * int(ratio + i)
    for i in range(rows):
        arco_radio = math.pi * int(ratio + i)
        angles.append(angle_total / round(arco_radio / (arco_total / len(df)), 0))
    coord = []
    for a in range(len(angles)):
        current_angle = angles[a] / 2
        for i in range(int(round(angle_total / angles[a], 0))):
            coord.append((ratio + a, current_angle))
            current_angle += angles[a]
    coord = Sort_Tuple(coord)
    # Ensure the lengths match exactly with the DataFrame length
    coord = coord[:len(df)]
    df["radio"] = [x[0] for x in coord]
    df["tetha"] = [x[1] for x in coord]
    df["INITIAL"] = df[initial].apply(lambda x: x[0])  # Only for text in marker chart
    return df