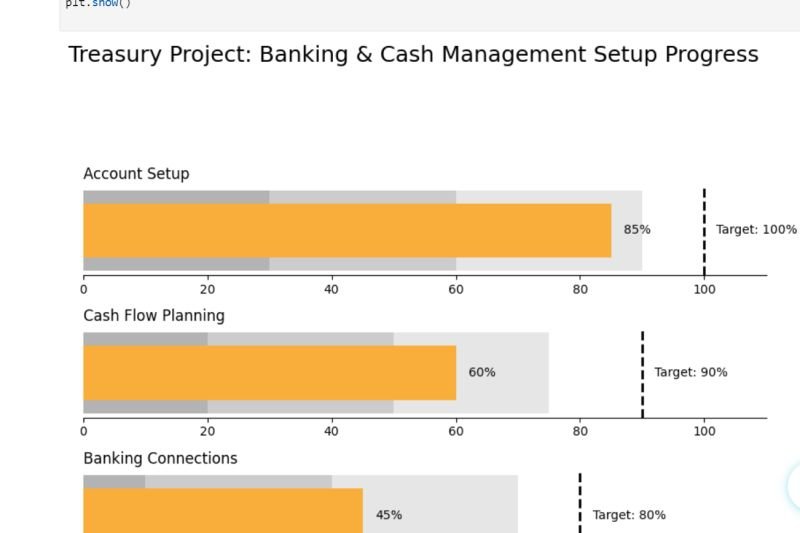
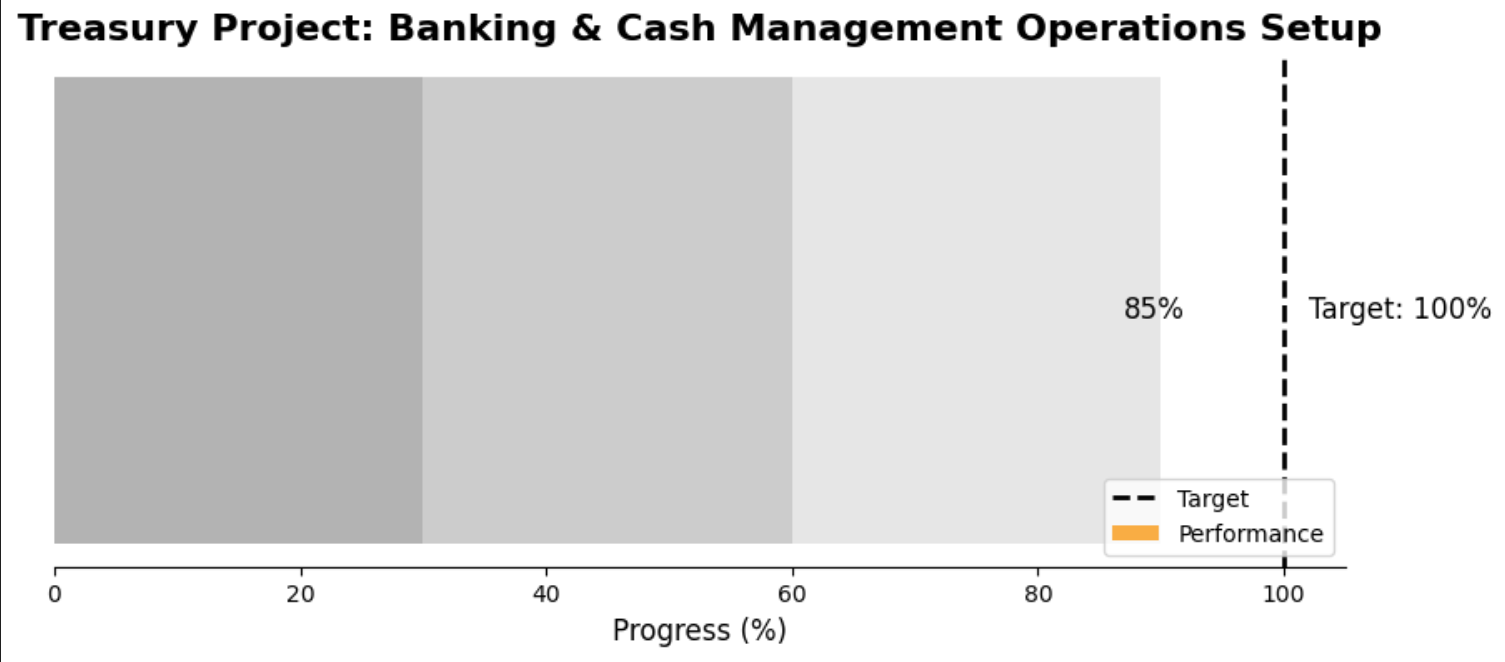
Bullet charts offer a clear comparison between target values and actual performance, while also highlighting key thresholds. These charts are an effective way to convey performance against set targets and thresholds. They provide a compact representation of how well a specific metric performs, allowing stakeholders to assess progress and identify areas for improvement quickly.

1. Import the libraries
- Start your Python script by importing the Matplotlib library.
import matplotlib.pyplot as plt2. Define the data variables
- Set the data variables that will be used in the bullet chart. You will need to define the target value, actual performance, and the thresholds.
target = 100  # Target value (e.g., the goal for project completion)
performance = 85  # Actual performance (e.g., current progress)
thresholds = [30, 60, 90]  # Thresholds (e.g., milestones)
3. Create the bullet chart
- Initialise the figure and axes for the bullet chart using Matplotlib's subplots() method. You can adjust the figure size to fit your design preferences.
fig, ax = plt.subplots(figsize=(10, 4))4. Plot the performance bar and target line
- Add a horizontal bar to represent the current performance value. You can customize the color and height of the bar.
- Use the axvline method to draw a vertical dashed line that represents the target value on the chart.
ax.barh(0, performance, color='#f9ad3a', height=0.4, label='Performance')
ax.axvline(target, color='black', linestyle='--', linewidth=2, label='Target')
5. Plot Thresholds as Background
- Add horizontal bars to represent the thresholds as background colors. This gives context to the performance value.
ax.barh(0, thresholds[2], color='#e6e6e6', height=0.6)
ax.barh(0, thresholds[1], color='#cccccc', height=0.6)
ax.barh(0, thresholds[0], color='#b3b3b3', height=0.6)
6. Set Title, labels, and legends
- Add a title and label the x-axis to give more context to the chart. You can also remove the y-axis ticks for a cleaner look.
- Add a title and label the x-axis to give more context to the chart. You can also remove the y-axis ticks for a cleaner look.
- Include a legend to explain the different components of the chart.
ax.text(performance + 2, 0, f'{performance}%', va='center', fontsize=12)
ax.text(target + 2, 0, f'Target: {target}%', va='center', fontsize=12)

ax.set_title('Treasury Project: Banking & Cash Management Operations Setup',
             fontsize=16, weight='bol)
ax.set_xlabel('Progress (%)', fontsize=12)
ax.set_yticks([])  # Remove y-axis ticks

ax.legend(loc='lower right', fontsize=10)
7. Clean Up the Chart Appearance
- Remove unnecessary spines for a cleaner visual appearance. .
ax.spines['top'].set_visible(False)
ax.spines['right'].set_visible(False)
ax.spines['left'].set_visible(False)
ax.spines['bottom'].set_linewidth(0.8)
8. Show Chart
- Finally, use the plt.show() method to display the bullet chart.
plt.show()